I have read a great deal lately in the Blogosphere and mainstream media criticizing the bankruptcy reform legislation. A common refrain is that the primary reason for rising consumer bankruptcy filings is reckless extension of credit by lenders, and that the bankruptcy reform legislation improperly lets lenders “off the hook” by bailing them out from their reckless ways. Some even claim that my own data presented a few weeks ago on trends in installment versus revolving debt actually prove the point. That chart, however, presented data on the amount of consumer credit outstanding and a percentage of disposable personal income. It is useful, albeit imperfect, for illustrating the substitution effect of revolving for installment credit by households, especially because it is the only data set that I have seen that collects this information.
It turns out that when you actually look at the data, the evidence fails to support the notion that Americans are “drowning in debt” or that they creditors are recklessly extending credit to unworthy borrowers. Instead, as measured by conventional measures, the financial condition of American households is largely the same as it ever was. What has changed, therefore, seems to be the willingness of people to choose to file bankruptcy in response to financial difficulties, not an increase need to file bankruptcy because of excessive debt.
Although comparisons of total debt stock to current income flows are often used by those who purport that Americans are drowning in debt, in fact, that is not a useful measure of household financial condition, especially when other more useful measurements of household debt are readily available.
In fact, bankruptcy law generally has two measurements of insolvency: equity insolvency and balance sheet insolvency. The first is a “flow” measure of one’s ability to pay his or her debts as they come due–i.e., the ability to pay monthly debt obligations out of current income flows. The latter is a “stock” measure of the ratio of total assets to total debt at liquidation.
The first, equity insolvency, is the more useful of the two for households, so I will deal with that one here. Looking at changes in equity insolvency measurements for American households, the data simply do not reveal an overwhelming debt obligation for consumers.
By contrast, those who believe the “drowning in debt” story point to the debt-to-income ratio–i.e., the ratio of total debt obligations to current income. But this is silly because it fails to account for changes in interest rates and loan maturity terms.
Consider first, the effects of changes in interest rates. The effect of lower interest rates on the debt service ratio can be substantial. Consider a 30 year mortgage of $100,000. As noted, at an interest rate of 10%, the monthly payments on the mortgage will be $877.57 per month. But if the interest rate falls to 5%, the same mortgage requires only $536.82 per month—a reduction in the current debt burden of $340 per month. This means that at an interest rate of 5%, the household could afford to increase its total principle debt burden on the mortgage by sixty percent (to over $160,000) and leave its debt service ratio remain unaffected.
Consider second, loan maturities. Consider a hypothetical borrower who borrows $100,000 at 10% interest rate. If the loan is for a term of 1 year, the borrower will be required to pay $8,791.59 per month; if the term is 5 years, the payments fall to $2,124.70 per month; for 10 years it is $1,321.51 per month; and for 30 years (the conventional term for a mortgage) the required payments are only $877.57 per month. Clearly the maturity term of the loan makes a large difference in monthly payments and the percentage of income dedicated to loan service.
Put in more simple terms–a major reason why houses have risen in value in recent years is because of the low interest rates on household mortgages. If interest rates fall, consumers can actually pay more for a house–thereby borrowing a larger principle amount and increasing their total stock of debt–but can actually have a lower monthly payment obligation than would otherwise be the case. Anyone out there who has refinanced and take additional cash out will know that it is possible to simultaneously increase one’s total debt, while decreasing the monthly payment on the larger loan.
And, in fact, since the early 1990s interest rates have fallen and loan maturities have lengthened on average. Thus, even though total household indebtedness has gradually and consistently risen during this period, the household debt service ratio has remained fairly constant.
The Federal Reserve measures this phenomenon through the debt-service ratio, which has stayed relatively constant over time, even as the total amount of household indebtedness has risen. Consider the following chart from my article, “An Economic Analysis of the Consumer Bankruptcy Crisis”, forthcoming in the Northwestern Law Review (working paper available here):
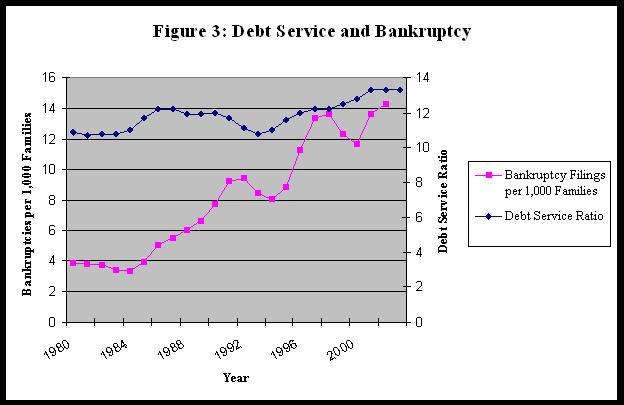
As this chart quite plainly shows, once we adjust household debt to take account of the record-low interest rates of the past decade, and lengthening loan maturities, we cannot blame rising consumer bankruptcies on overwhelming debt obligations. There does appear to be some relationship between short-term fluctuations in the debt service ratio and fluctuations in the bankruptcy filing rate. But the upward trend in bankruptcy filings cannot be explained by comparable changes in the debt-service ratio.
Two lessons are clear. First, Americans are not “drowning in debt.” Rather, once you adjust for the record-low interest rates of recent years, it is clear that American households are roughly in the same position as they always have been. Second, make sure you have the correct data to do the job you are trying to do.
Comments are closed.