Privatization and the Law and Economics of Political Advocacy, Part 3 -- The Model:
This post continues my series on my upcoming Stanford Law Review paper on Privatization and the Law and Economics of Political Advocacy (see here for the technical paper). This installment is not connected to privatization specifically at all, much less prisons, but gives (in plain English) the basic economic theory behind public goods and free riding.
* * *
I now present the main model I use to predict how industry actors will react to privatization. The central feature of the model is that industry-increasing advocacy is a public good. Privatizing part of the industry therefore introduces a collective action problem: Unless everyone in the industry cooperates with each other, they will together spend less on industry-increasing advocacy than a single firm would if it covered the whole industry, because a portion of their expenditures will benefit their competitors.
This intuition should not be surprising, as it is standard in the literature on public goods. When a good is private, everyone pays for, and enjoys, only his own consumption. By contrast, when a good is public, in the classic model, everyone benefits from the total amount, and this amount is determined by the total amount of contribution.
If we benefit from our national defense, we benefit from the full amount, not from the chunk we paid for; we cannot be excluded from the full benefit, no matter how little we paid; and the total amount of national defense is just determined by how much money Congress allocated to national defense from the Treasury. A tax-funded program that improves air quality benefits everyone who breathes the relevant air, whether or not they contributed to the program; and the total improvement is just determined by the amount of resources directed toward that goal.
Similarly, contributing to a candidate’s campaign benefits all of his supporters; and it is not too implausible to say, as an approximation, that to the extent the money he raises and spends affects his probability of winning, it is only the total amount of money that matters.
In all these cases, the temptation to free ride off one’s fellows’ contributions is strong—so strong that the category of “public goods” is standard among economists as a case of “market failure.”
To explore the basic model, consider a monopolist, who's willing to invest some amount of money in lobbying to increase the size of his industry. To determine that amount, he weighs the benefit that his money can buy—the expansion of the industry is worth something to him, and money can help his policy pass—against the cost of the lobbying.
If that firm is broken up into two smaller firms—say a 90% incumbent firm and a 10% splinter firm—the larger incumbent isn’t willing to spend as much as it used to be, because the costs of lobbying are the same while the benefits are 10% less than they used to be. And the smaller splinter firm won’t be willing to spend anything, because it will be satisfied free-riding off the larger incumbent’s lobbying. Thus, splitting up an industry tends to decrease industry-expanding lobbying.
The rest of this post will illustrate this intuition graphically.
Suppose you are, as economists say, a rational, risk-neutral expected utility maximizer. One may dispute how much of life this assumption can explain, but on balance it seems to be at least a good starting point for predicting the behavior of business organizations. You are faced with the choice of whether or not to spend a dollar on political advocacy—donating to the campaign of a politician or voter initiative, contributing to your trade association’s lobbying expenses, or running an ad—in favor of some reform that could increase the size of your market. We may assume that this dollar has some influence in the world, whether appropriate or inappropriate—it could corrupt a legislator, raise the chance of his election, contribute to the passage of the initiative, or change popular opinion.
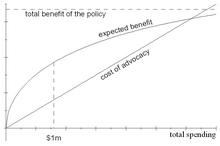
The benefit of this dollar is the value of the increased probability of getting your desired policy change. It is reasonable to think that spending money on advocacy is subject to decreasing marginal returns, so each additional dollar gets you less and less benefit. The cost of a dollar, on the other hand, is and remains $1, no matter how many of them you spend. As long as the benefit of an advocacy dollar is greater than $1, you continue spending; and you stop as soon as that benefit reaches $1. Finally, you settle on the optimal total amount of advocacy spending—say $1 million.
The picture below illustrates the situation. The expected benefit—that is, the probability of success times the benefit—is represented by the curved line below: The more you spend, the greater the probability of success, but the less you get for each extra dollar; and because a probability can’t get any higher than 1, the curve is bounded above by the dashed line representing the total benefit of the policy. The cost of advocacy is represented by the straight line below: Each dollar of advocacy costs $1. Your problem is to maximize the vertical distance between the expected benefit curve and the cost line. In the figure, that maximum distance occurs at a spending level of $1 million.

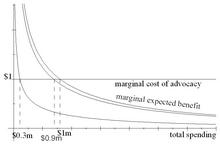
The next picture is an equivalent way of seeing the same problem. The curve below represents the marginal expected benefit—that is, the benefit of an extra dollar of spending, which is just equal to the total benefit times the extra probability that a dollar buys you. As noted above, the marginal benefit is decreasing. The straight line is the marginal cost of advocacy: An extra dollar of advocacy always costs $1. If the marginal expected benefit is above $1, you’re not spending enough; if it’s below $1, you should cut back. At a spending level of $1 million, an additional dollar of spending gives you exactly $1 of expected benefit.

Now suppose the Department of Justice’s Antitrust Division comes in and splits you up, so that you now have 90% of the market and are faced with a competitor with the other 10%. Your previous optimal amount, $1 million, is no longer optimal for you: The cost of that last dollar was $1, and while the benefit of the dollar is $1 for the whole industry, you, who now represent only 90% of the industry, only see 90¢ of that benefit. All your benefits are now lower by 10% because you have to share them with your competitor; for our purposes, the split-up thus has the same effect as a 10% tax on your benefit.
Because your spending on advocacy—an investment in the growth of your industry—is only 90% as productive, you do less of it. You start cutting back on your spending, because a dollar saved puts $1 back in your pocket and only reduces your benefits by 90¢. As you cut back more, the benefit of the last dollar rises; you stop cutting back as soon as the benefit of your last dollar to the industry reaches about $1.11 (which is a $1 benefit to you). Call the new amount $900,000.
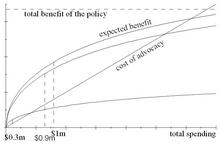
This new situation is illustrated in the next pictures. In the next one, the top curve is the expected benefit to the whole industry (as before), and the second curve is your expected benefit, newly reduced now that you only have 90% of the industry. The bottom curve is your 10% competitor’s expected benefit. The maximum vertical distance between your curve and the cost line now occurs at $900,000, and the maximum distance between your competitor’s curve and the cost line occurs at $300,000.

In the next picture, the equivalent graph that shows marginal quantities instead of total quantities, you want to find the point where the marginal expected benefit to the industry is $1.11. This is equivalent to finding the point where 90% of the marginal expected benefit (i.e., the benefit to you) is $1. That point is again $900,000. And your competitor wants to find the point where the marginal expected benefit to the industry is $10, which gives him $1; this is again $300,000.

This story is incomplete. You don’t want the amount spent to be exactly $900,000; obviously, you would be thrilled if other people happened to contribute more. It’s just that you’re not personally willing to put any dollar into the pot after the 900,000th. You want the total amount spent to be at least $900,000, and are willing to contribute money until that point is reached, but you stop being willing to personally contribute once you’re holding the 900,001st dollar.
This is because, in this model, the benefit of a dollar only depends on the total amount of money spent, and if the 900,000th dollar had a benefit to the industry worth $1.11 (and thus a benefit to you worth $1), then the 900,001st dollar has a benefit worth slightly less than $1.11.
Your new competitor, who represents the remaining 10% of the industry, and who is equally interested in this reform that will increase the size of the pie, wants the total amount spent to be at least $300,000, and won’t put a 300,001st dollar into the pot.
All this leads to two conclusions.
First, the total amount spent should not exceed $900,000. If it did, you would want to take some money out of the pot, since the dollars beyond the 900,000th are giving the industry a benefit below $1.11, and therefore giving you a benefit below $1.
Second, there’s no reason for your competitor to spend anything. He’s unwilling to spend any dollar beyond the 300,000th, since its marginal benefit to the industry is under $10, and so its marginal benefit to him is under $1. Thus, suppose you were going to spend $600,000 and he was going to spend $300,000. These actions would not be an equilibrium, since he would prefer to keep his $300,000. Why should he spend any extra dollar beyond the $600,000 you’re already spending, if the 300,001st dollar already isn’t worthwhile to him? The only equilibrium is where you give $900,000 and he gives $0. Because he’s the smaller actor, he totally freerides off you. The result is what Mancur Olson calls the “systematic tendency for ‘exploitation’ of the great by the small.”


